Quick Start Guide
This page will show you the basics of how to make an interactive plot with SYD. It’s a pretty simple example, but it’s a good starting point. We’ll make a simple sine wave plot where we can control the frequency, amplitude, and color of the wave.
Creating Your First Interactive Plot
1. Create a viewer object.
This returns a viewer object that you can use to add interactive components to your plot and then deploy it.
from syd import make_viewer
import matplotlib.pyplot as plt
import numpy as np

viewer = make_viewer()

# Note: if your plot function is already defined, you can also do this:
# viewer = make_viewer(plot)
2. Add a plotting method to the viewer.
This method will be called whenever the viewer is deployed or when a parameter is changed. Some notes:
All plot methods have to take a single argument:
state.Stateis a dictionary that contains the current values of all the parameters in the viewer.The plot method should create and return a matplotlib figure. SYD will handle what to do with it - you just need to create it. Don’t call
plt.show()!
def plot(state):
    """Plot the waveform based on current parameters."""
    t = np.linspace(0, 2*np.pi, 1000)
    y = np.sin(state["frequency"] * t) * state["amplitude"]
    fig = plt.figure()
    ax = plt.gca()
    ax.plot(t, y, color=state["color"])
    return fig

viewer.set_plot(plot)

# Note: you can also add the plot when you make the viewer with:
# viewer = make_viewer(plot)
3. Add parameters to control your plot.
These parameters will be converted into interactive components that you can control manually to change the plot. SYD will automatically use the right component depending on the type of parameter you pass in. In this example, we’re using two float sliders and a dropdown menu.
Each parameter requires a name (here it’s
'frequency','amplitude', and'color').The
valueargument is the initial value of the parameter – it’s required.Each parameter type might have it’s own additional arguments, most of them are required.
viewer.add_float("frequency", value=1.0, min=0.1, max=5.0)
viewer.add_float("amplitude", value=1.0, min=0.1, max=2.0)
viewer.add_selection("color", value="red", options=["red", "blue", "green"])
4. Show or share the viewer!
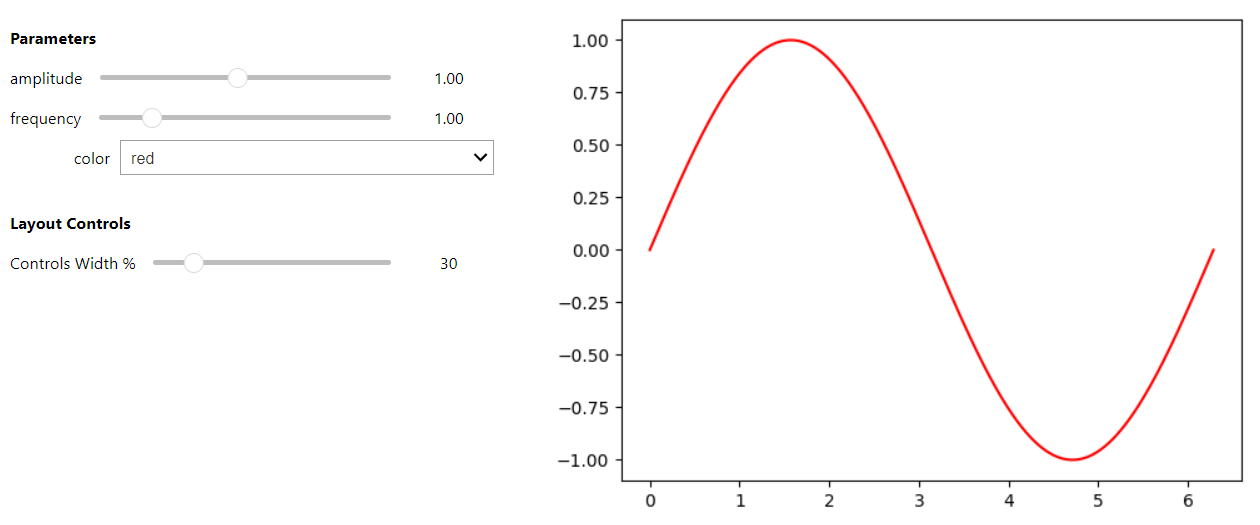
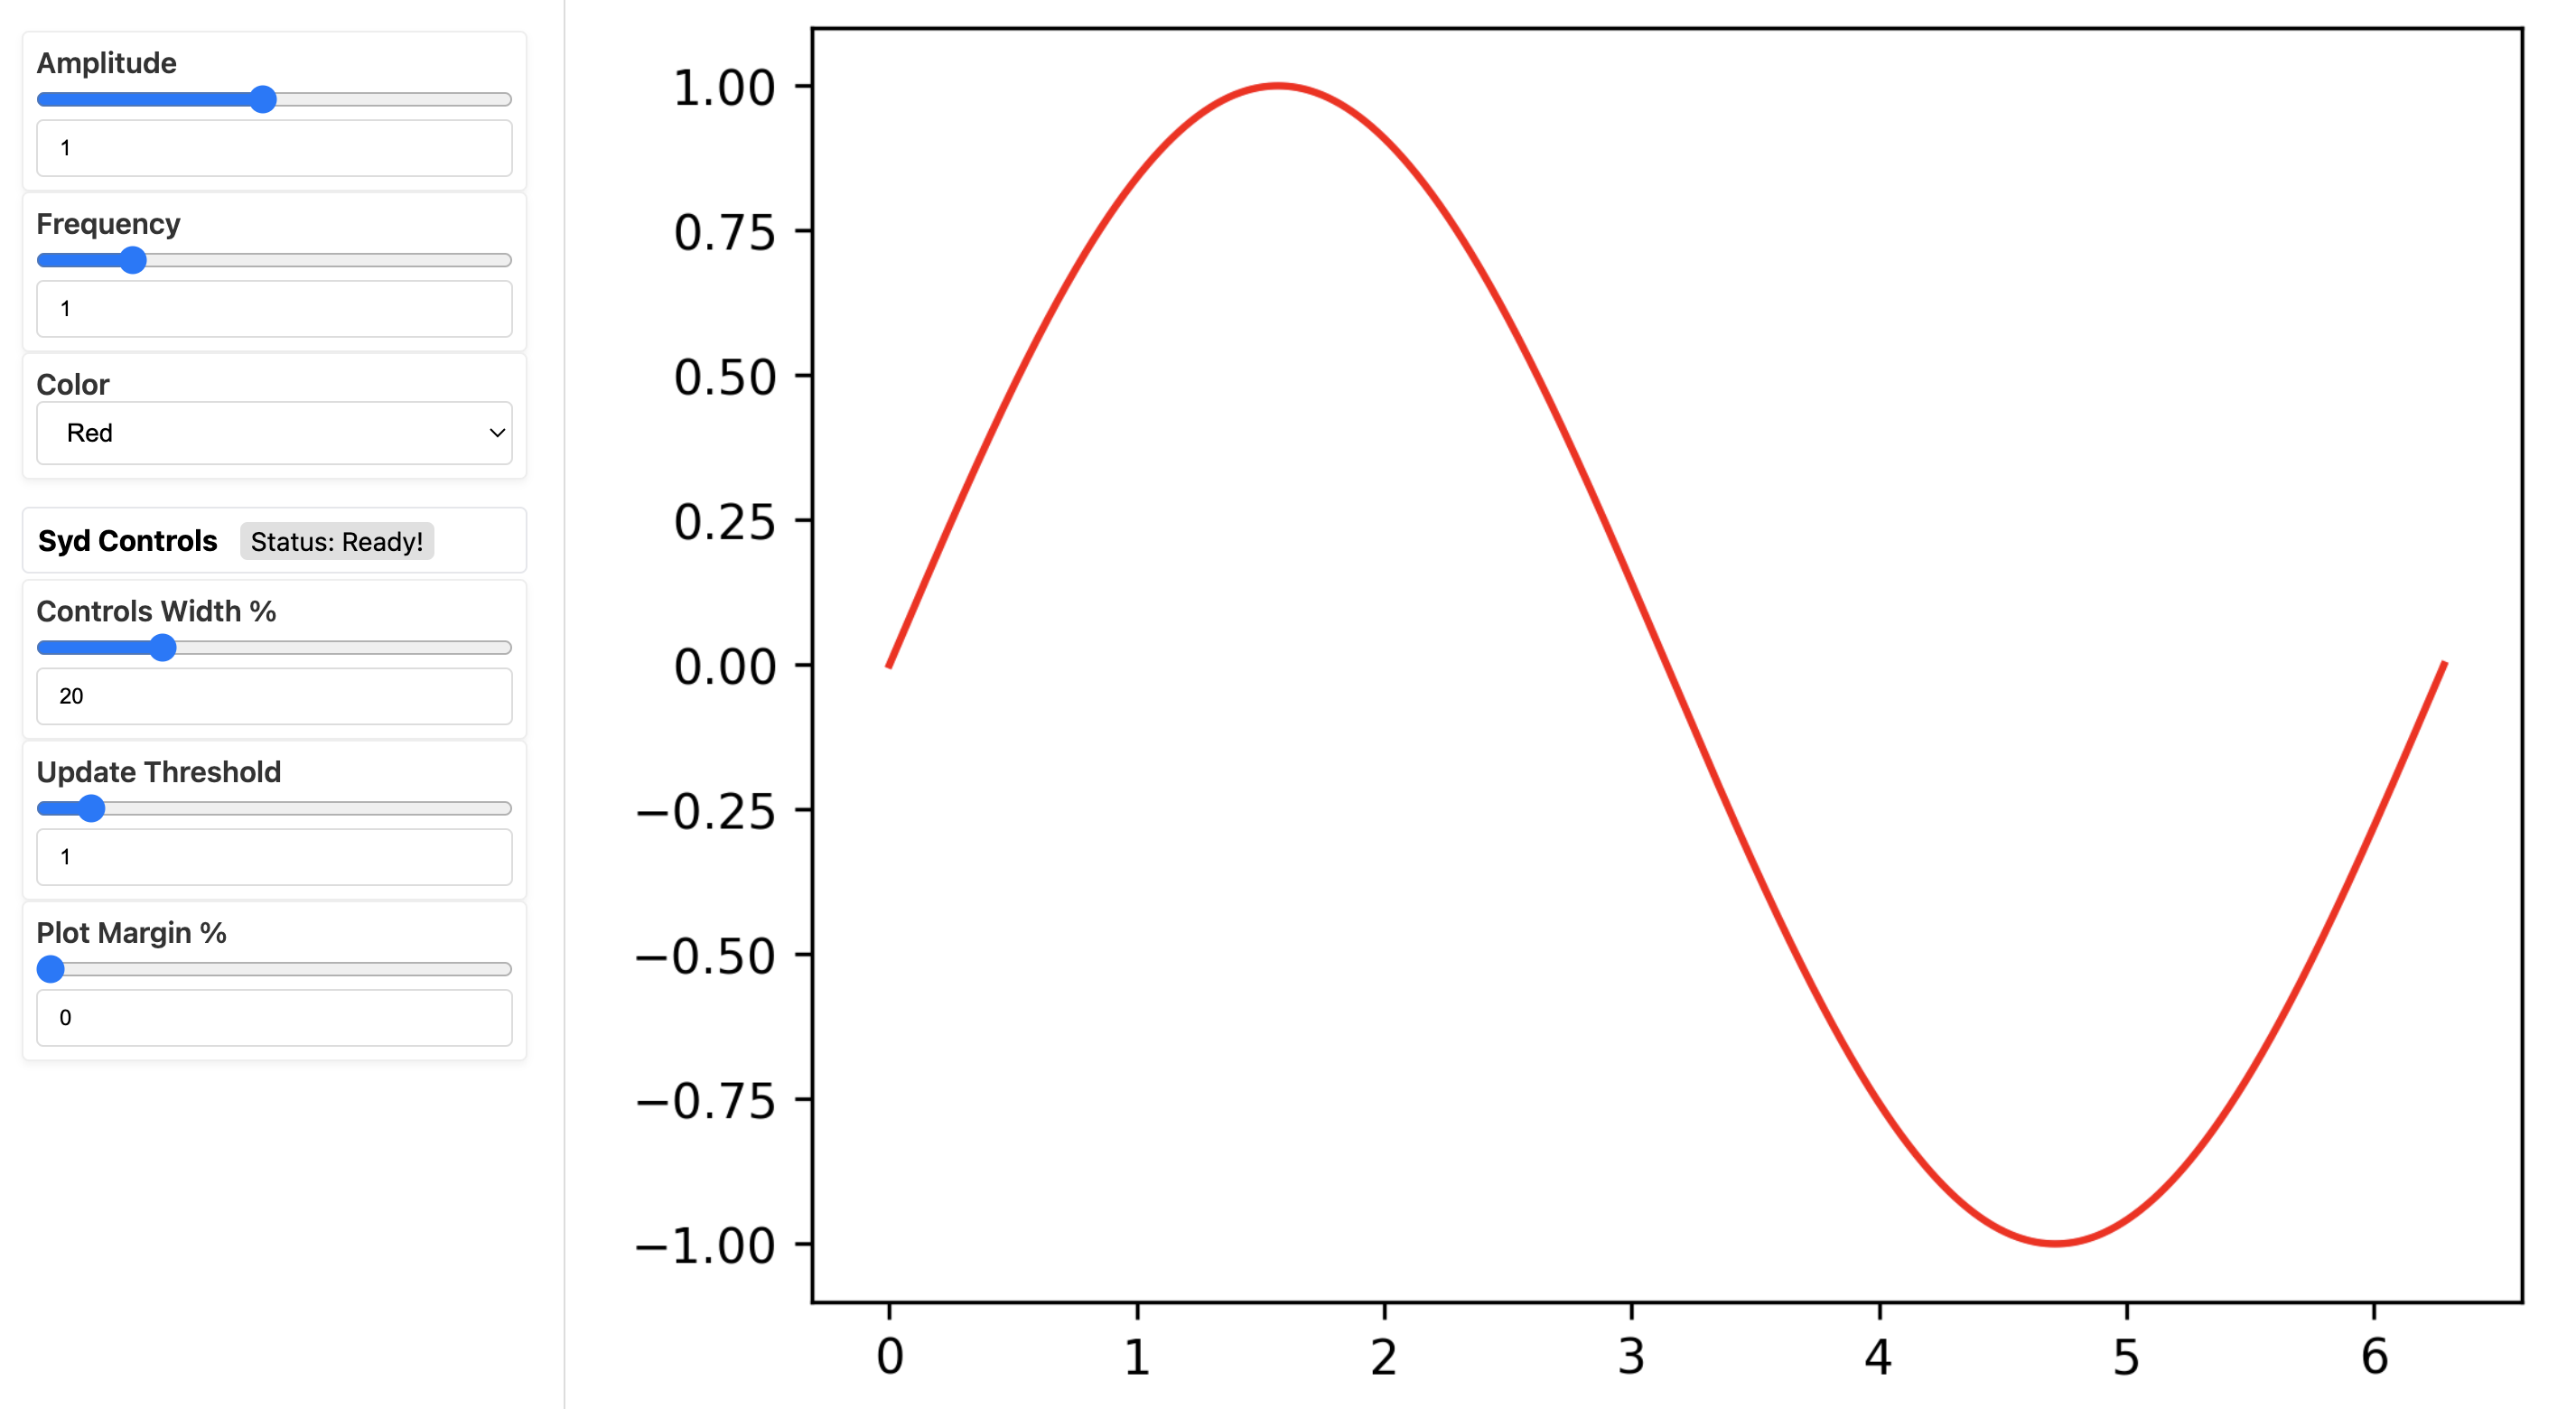
You can view your GUI (“deploy” in Syd lingo) in a jupyter notebook or on a web-browser. There’s
two commands you can use for each environment, show() and
share() for notebook and browsers, respectively. Use the tabs below to
see what it looks like in each environment.
viewer.show() # for viewing in a jupyter notebook
viewer.share() # for viewing in a web browser

# If you want to set the port manually, you can add the kwarg!
# for example:
# viewer.share(port=8080)
# Otherwise, it'll select the first available port automatically.

# (There's other customization settings you can add, see the docs for more details)
You can check out the above example in a notebook here or run it yourself in colab:
Learn More About How to Use SYD
There’s a lot more you can do with SYD. To learn more, check out the following sections:
Section |
What for? |
|---|---|
Learn about the different types of parameters you can use to create your interactive plots. |
|
Learn how to create more complex interactive plots with SYD. |
|
See more fleshed out examples of how to use SYD. |
|
Learn about some common questions and concepts about using SYD. |
|
Learn about the SYD API and how to use it to create your own custom components. |