Welcome to Syd’s documentation!
Syd is a Python library for creating interactive matplotlib visualizations with just a few lines of code. It allows you to make interactive GUIs for data science with ease and expediency. No boilerplate, no complicated GUI state management, just a few lines of code to define interactive components, and Syd will handle the rest.
Example
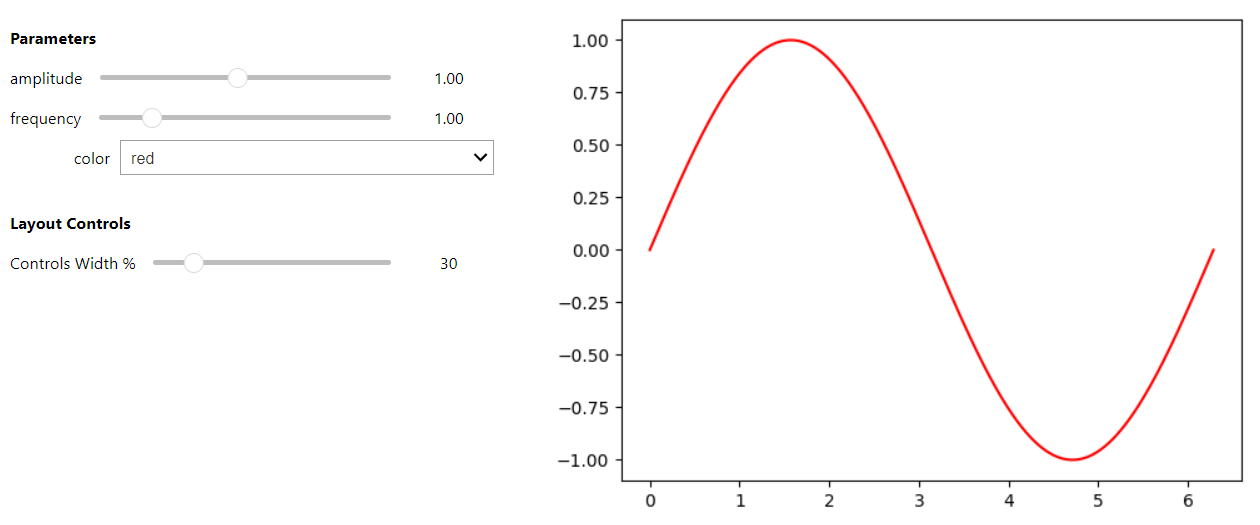
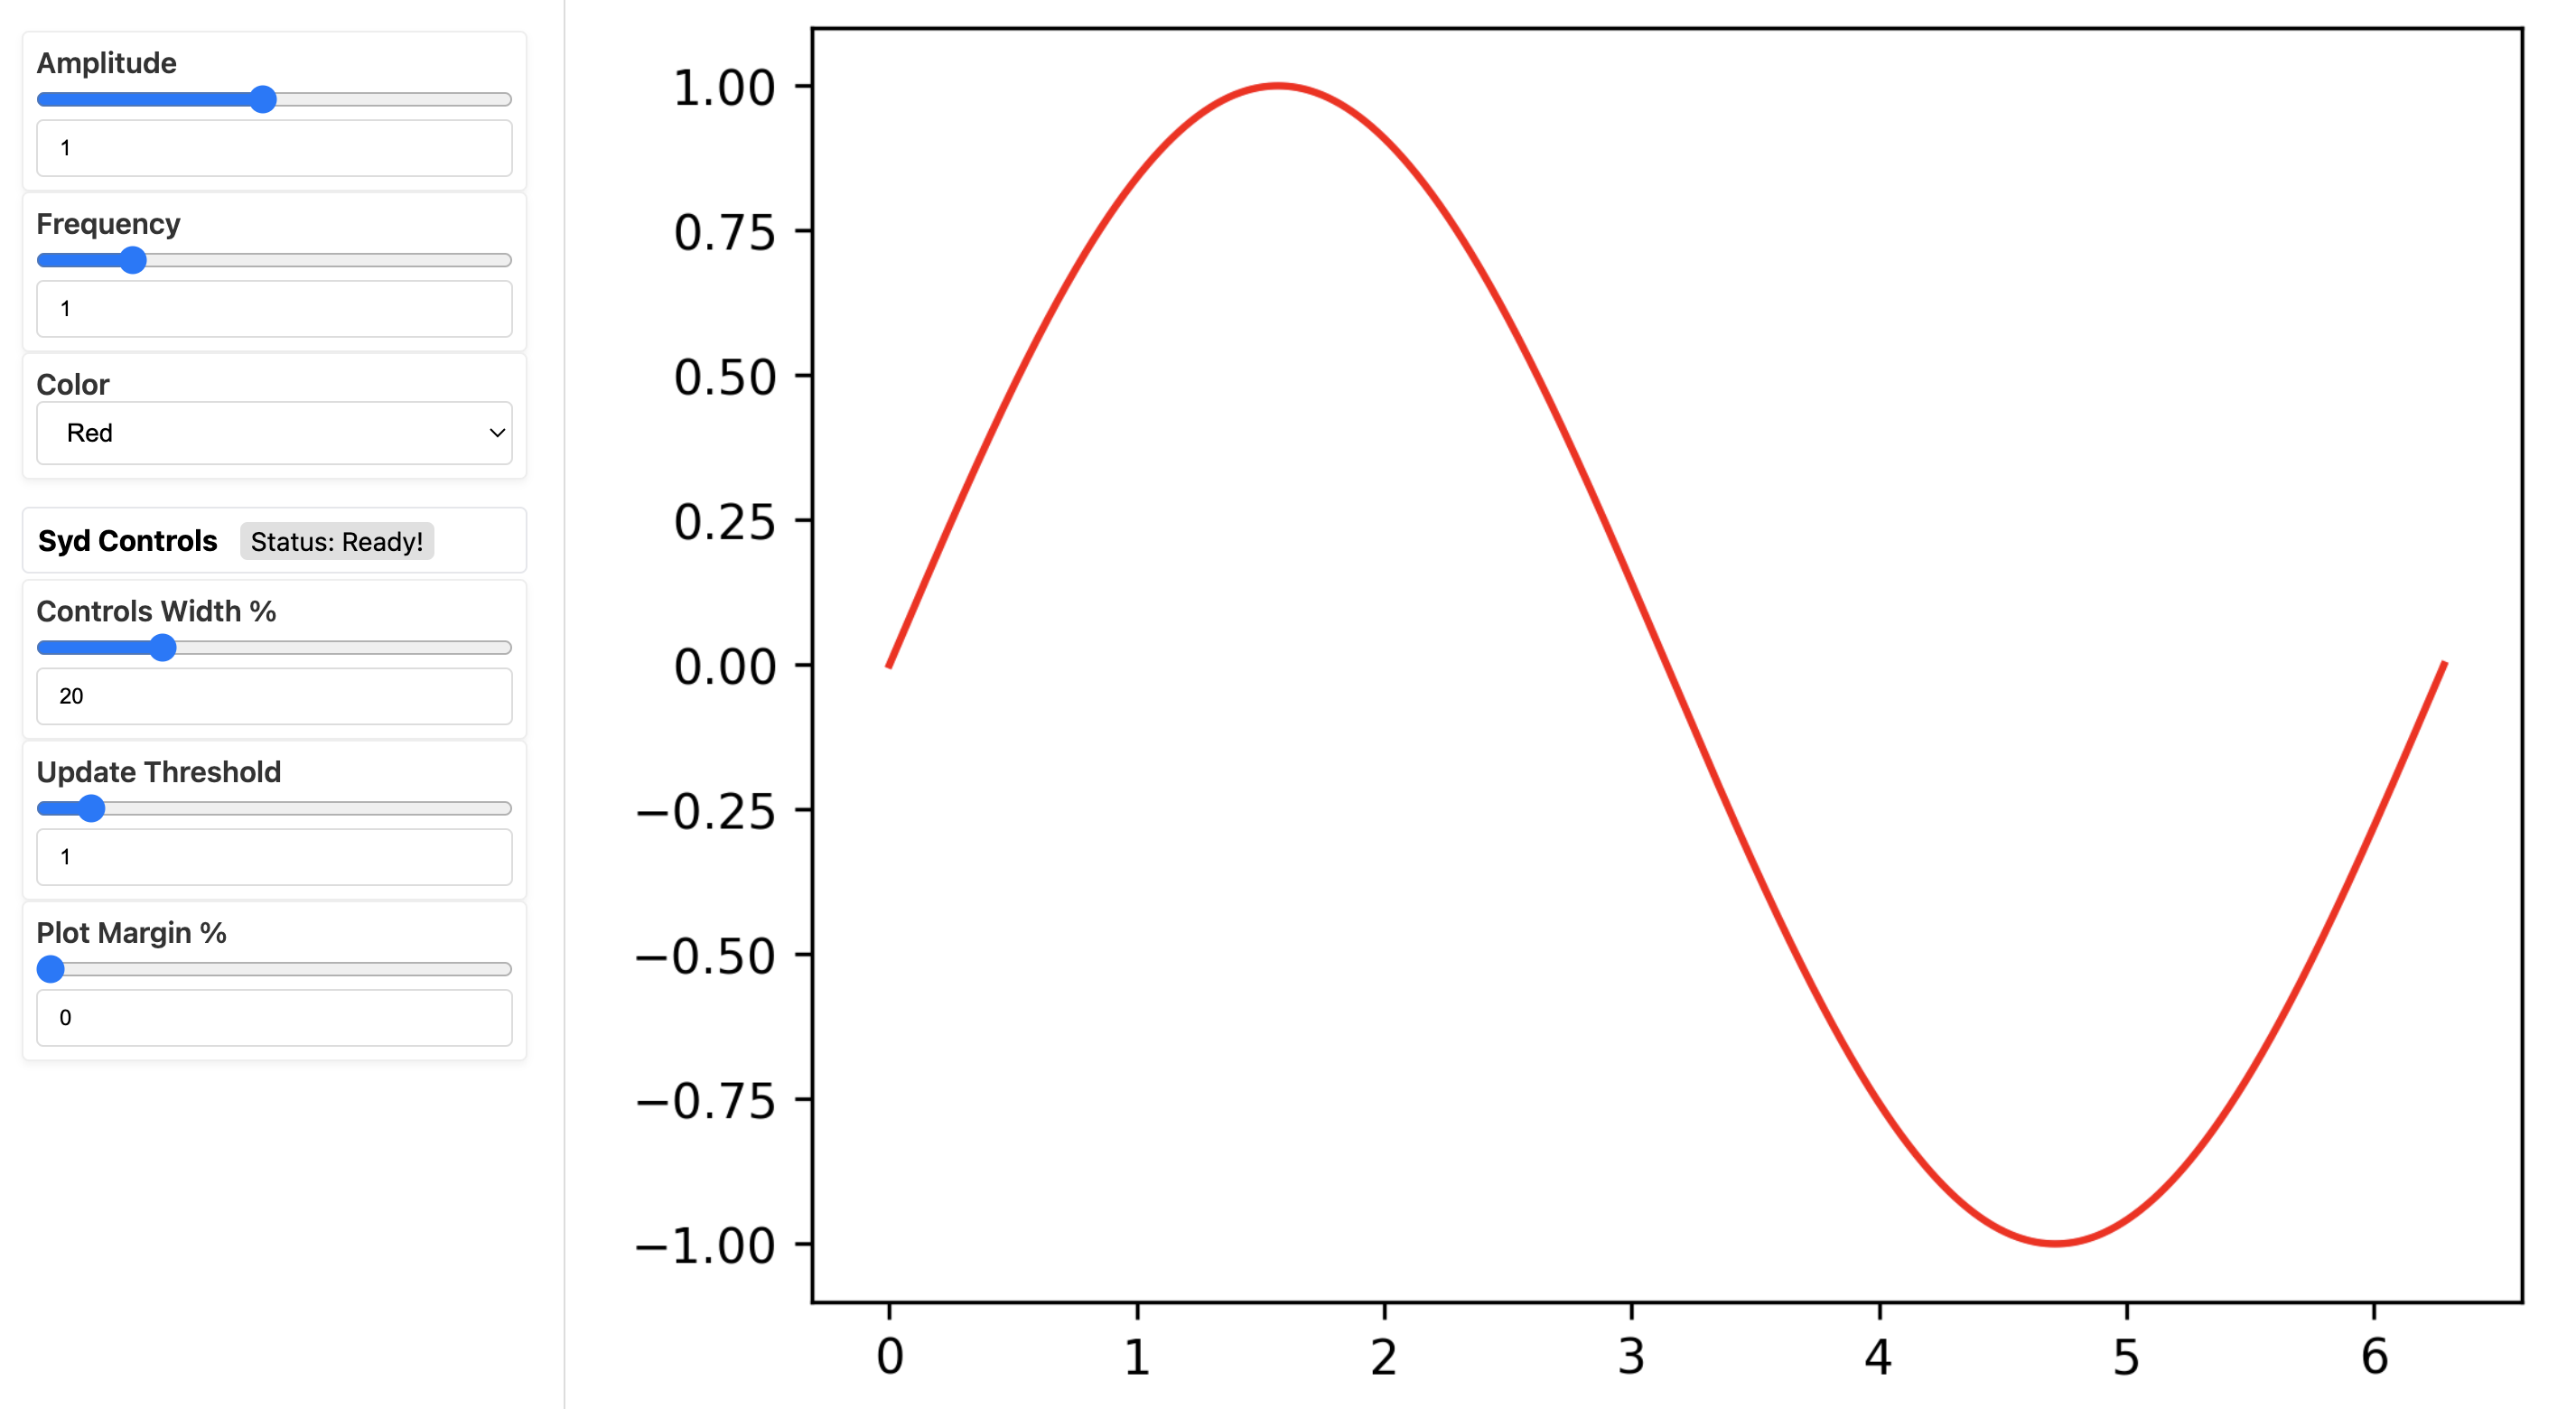
This example is just to show how easy it is to make an interactive plot with Syd. We’ll make a simple sine wave
plot where we can control the frequency, amplitude, and color of the wave. All you have to do is define the plot
function, create a viewer object, define a few parameters (here they’re called frequency, amplitude, and
color), and then call viewer.show() to view the plot in a jupyter notebook or viewer.share() to view
it in a web browser.
To understand the mechanics of how it works, check out a thorough explanation of the sine-wave viewer in the Quick Start Guide section or learn more in the Tutorial.
from syd import make_viewer
import matplotlib.pyplot as plt
import numpy as np

def plot(state):
   """Plot the waveform based on current parameters."""
   t = np.linspace(0, 2*np.pi, 1000)
   y = np.sin(state["frequency"] * t) * state["amplitude"]
   fig = plt.figure()
   ax = plt.gca()
   ax.plot(t, y, color=state["color"])
   return fig

viewer = make_viewer(plot)
viewer.add_float("frequency", value=1.0, min=0.1, max=5.0)
viewer.add_float("amplitude", value=1.0, min=0.1, max=2.0)
viewer.add_selection("color", value="red", options=["red", "blue", "green"])
viewer.show() # for viewing in a jupyter notebook
from syd import make_viewer
import matplotlib.pyplot as plt
import numpy as np

def plot(state):
   """Plot the waveform based on current parameters."""
   t = np.linspace(0, 2*np.pi, 1000)
   y = np.sin(state["frequency"] * t) * state["amplitude"]
   fig = plt.figure()
   ax = plt.gca()
   ax.plot(t, y, color=state["color"])
   return fig

viewer = make_viewer(plot)
viewer.add_float("frequency", value=1.0, min=0.1, max=5.0)
viewer.add_float("amplitude", value=1.0, min=0.1, max=2.0)
viewer.add_selection("color", value="red", options=["red", "blue", "green"])
viewer.share() # for viewing in a web browser
Installation
You can install Syd using pip:
pip install syd
Or if you want to upgrade to get the latest features and bug fixes:
pip install --upgrade syd
Requirements
Python 3.8+
matplotlib
ipywidgets
ipympl
ipykernel
flask
Table of Contents
Contents:
- Quick Start Guide
- Components
- Tutorial
- 0. Define a dataset for plotting.
- 1. Create a viewer object.
- 2. Add components to the viewer that will interactively control your plot.
- 3. The state of the viewer
- 4. The last figure generated by the Syd GUI
- 5. Adding buttons to your viewer
- 6. Add a plot method to the viewer.
- 7. Adding callbacks to the viewer.
- 8. Show or share the viewer!
- 9. Putting it all together!
- Examples
- Frequently Asked Questions
- How do I add a parameter to a viewer?
- How do I update a parameter?
- How do I change the axis limits of a plot and keep them there?
- But like, how does Syd have access to my data?
- Syd is slow! What can I do? (Cache your data!)
- Wait, when are callbacks and plot functions called?
- My syd viewer isn’t showing, what’s wrong?
- How do I make the plots in a Syd viewer interactive?
- I want to use Seaborn in my Syd viewer, how do I do that?
- API Reference